In this ever-evolving world of e-commerce, if you want to be successful, pay attention towards key performance indicators (KPIs). These performance indicators have essential knowledge about how customers act as well as how efficiently operations run, and how well the business performs. The analysis of ecommerce metrics helps e-commerce businesses obtain information necessary for making decisions that support both expansion and profitability.
Looking to make your ecommerce website successful and don’t have an idea about key ecommerce metrics? Relax! At Proximate Solutions, we have listed 25 Ecommerce metrics in the blog to Help You Turn Data Into Revenue. Read this blog thoroughly and get to know what is essential for you!
Top Ecommerce metrics to track for growth are as follows:
The number of users visiting an online store makes the website traffic. Brand visibility and marketing performance can be measured through this basic metric. Knowing how visitors reach your website through direct organic and paid referrals contributes to understanding which paths deliver the most traffic. Organizations should use search engine optimization (SEO), content marketing coupled with social media engagement to increase website traffic. Traffic pattern monitoring throughout time creates observable trends that guide business strategy development.
Visitors who execute wanted actions on your site, like making a purchase, represent your conversion rate percentage. When your website makes successful sales to a significant portion of website visitors, you can consider it effective at customer acquisition. The enhancement of this metric depends on creating better user experiences and simplifying checkout processes while providing apparent calls to action. Testing discovers the perfect features that appeal to your audience, and A/B testing is perfect to do so.
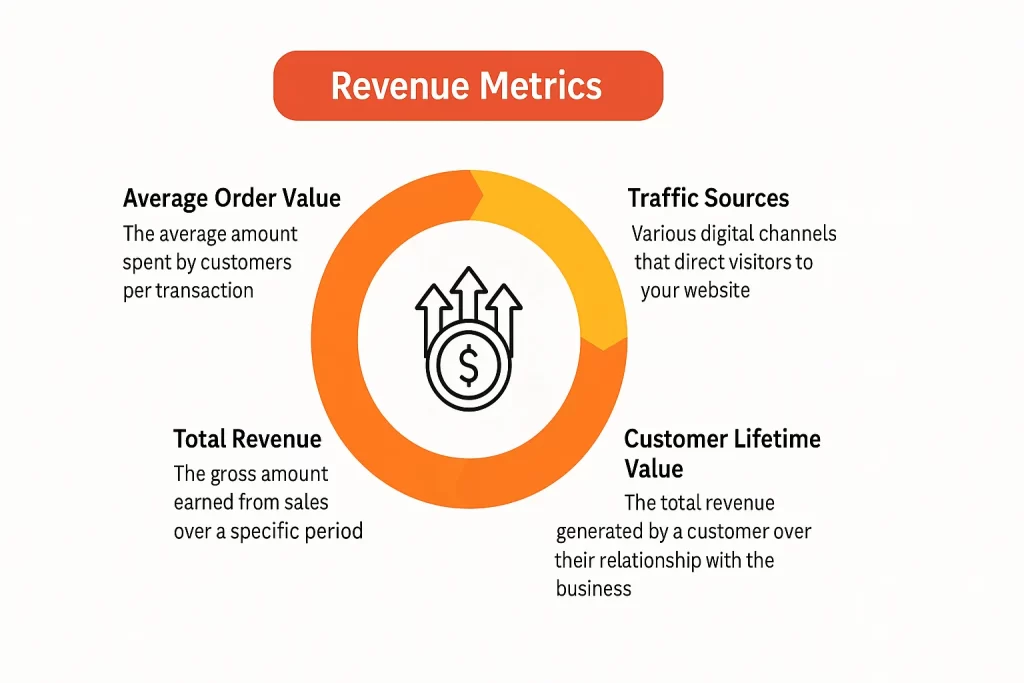
AOV stands for the total expenditure throughout one customer purchase process. Enhancing the average order value in your business will increase your monetary revenue without requiring new customer acquisition. You can easily improve AOV by offering product bundles, upselling complementary items, and implementing loyalty programs that encourage higher spending.
Companies use CAC to measure all expenses related to recruiting new customers by counting both marketing campaigns and advertising costs. Business success requires a clear comprehension of CAC because customers should not cost more than they generate long-term value. An improved CAC requires companies to develop precise customer targeting methods, affordable advertising platforms, and natural growth promotion through SEO and content marketing efforts.
Customer Lifetime Value allows businesses to forecast the total monetary revenue that will come from individual customer accounts. Assessing customer relationship long-term value becomes possible when reviewing CLV metrics in relation to CAC figures. Improving CLV depends on delivering outstanding service, tailored shopping experiences supported by loyalty reward systems, and motivation to buy again.
The percentage of users who add items to their cart but do not complete the purchase. High numbers of abandoned carts usually indicate problems with purchasing complexity, hidden fees, or unavailable payment methods. Cart abandonment can be reduced by keeping payments flexible and presenting costs clearly with an easy checkout procedure.
The percentage of users that exit from your site after looking at only one page is termed the bounce rate. If your visitors spend less than two seconds on your landing pages before returning to the previous page, you should check whether your pages are relevant to their needs. You can reduce bounce rate by loading website pages faster, and content delivers enhanced quality that matches visitor expectancies.
ROAS determines advertising performance through revenue calculations based on each dollar spent on promotional activities. Advertising efficiency increases when ROAS becomes higher. To improve ROAS it requires regular updates to ad creative formats, improved audience selection precision, and testing several advertising channels to identify the most economical choices.
Inventory turnover measures the frequency with which inventory sells out and generates new replacements within a stated period. High turnover rates demonstrate profitable sales performance with effective inventory control systems. An accurate assessment of sales data combined with demand forecasting and the avoidance of warehouse excess will enhance inventory turnover through effective just-in-time inventory management.
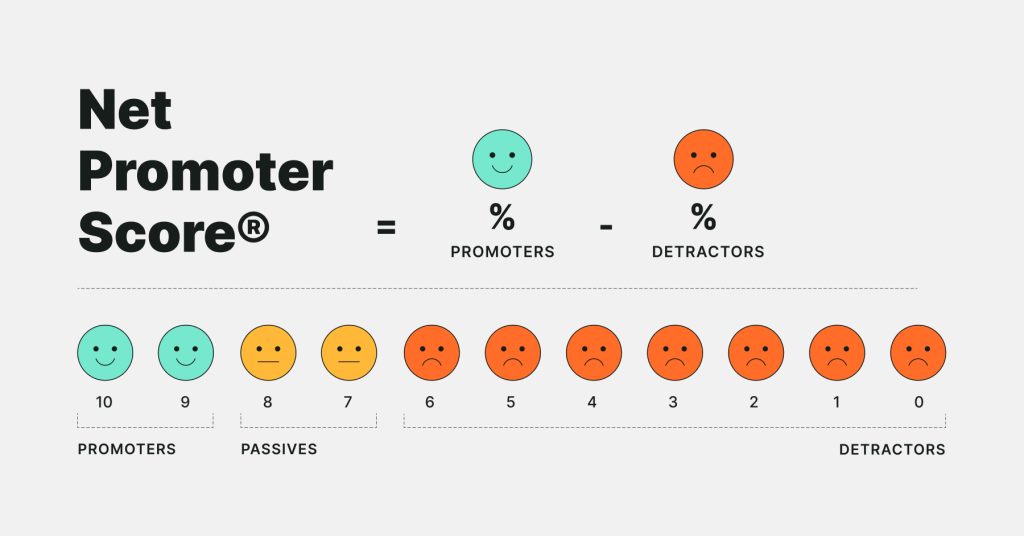
After conducting NPS research, you can determine customer satisfaction levels and loyalty through their recommendations to others. High customer satisfaction levels will generate an elevated rate of Net Promoter Score. Your NPS improvement strategy should deliver top-quality service and collect active feedback while fostering deep connections with all your clients across your customer base.
These metrics gauge the effectiveness of email marketing campaigns. Success in reaching recipients occurs when your emails receive high open rates and recipients choose to click through the emails. Achieving better email performance depends on engaging subject lines with personalized content and offering immediate value to customers in each message.
Social media analytic tools enable businesses to observe user reactions by monitoring social media engagement statistics, including likes, shares, comments, and total audience responses. Your involvement with readers helps attract more consumers while developing an audience focused on your brand. Social media engagement climbs through sharing content easily, maintaining steady contact with followers, and utilizing content created by users.
The continuous rise of mobile shopping demands that businesses track mobile audience movements and conversions to enhance the quality of their mobile user journey. To increase mobile conversions, you must design your website for mobile devices, enhance loading speed, and provide straightforward navigation paths.
Online pages that take too long to load will downgrade user satisfaction and search engine rankings. The loading speed of web pages determines both customer satisfaction and the number of bounces that website visitors perform. Images need optimization, and browser caching and code simplification help speed up loading times.
Issues with product quality or misaligned customer expectations result in high return rates. The reasons behind returns can inform product descriptions and quality control. Clear product images, detailed descriptions, and customer reviews can help set accurate expectations.
The metric defines the percentage of customers who make repeat purchases. A high retention rate means your customer is satisfied and loyal. You can enhance your retention rate by implementing loyalty programs, personalized marketing, and excellent customer service.
Gross profit margin indicates the share of revenue left after subtracting the cost of goods sold (COGS), whereas net margin represents profit after every expense, including operations, marketing, and taxes. Both margins are crucial indicators of overall profitability and operational effectiveness. For their enhancement, analyze your pricing models, secure improved supplier contracts, and manage operational expenses without damaging customer experience.
Average time spent by users on your website is a great measure of engagement. Longer session times usually indicate that visitors are interested in your products or content. If users leave immediately, it may indicate a bad UX or irrelevant content. Enhance this metric by optimizing product pages, employing strong visuals, and adding internal links to similar products and blog articles.
CSAT is gauged by direct questioning customers as to whether they’re satisfied with a product or service. It’s an easy but effective measure of overall satisfaction. To boost your CSAT, make customer support more accessible, enhance product quality, and provide after-sales support that goes beyond expectations.
Knowing what marketing channels (email, social media, pay-per-click advertising, SEO) are generating the most revenue helps you budget your dollars more strategically. Monitor channel performance using Google Analytics or Shopify analytics. Reinvest in successful channels, and optimize those not performing as well or needing to be better strategy aligned.
Not every product page converts the same. Monitoring the performance of every single product page determines what works and what doesn’t. Experiment with various layouts, product descriptions, CTAs, and review placements. Rich media such as videos or 360° views can dramatically increase engagement and conversions.
Exit page analysis indicates where users tend to leave your site. This can help determine friction points in the customer flow. For instance, if users tend to leave from the cart page, your checkout process might be too complex. Utilize heatmaps and session recordings to observe what’s occurring and improve UX based on that.
If you offer subscriptions, your churn rate is the rate at which customers cancel during a given period. High churn indicates that users aren’t experiencing long-term value in your service or product. To limit churn, invite users with onboarding messages, reminders, and incentives for longer-term subscription.
This tracks how many visitors become leads (email list subscribers, account creators, etc.). A solid ratio means that your site attracts quality traffic. If the ratio is low, rethink your messaging or CTA placements. Make use of lead magnets such as discounts, free downloads, or special offers in order to generate conversions.
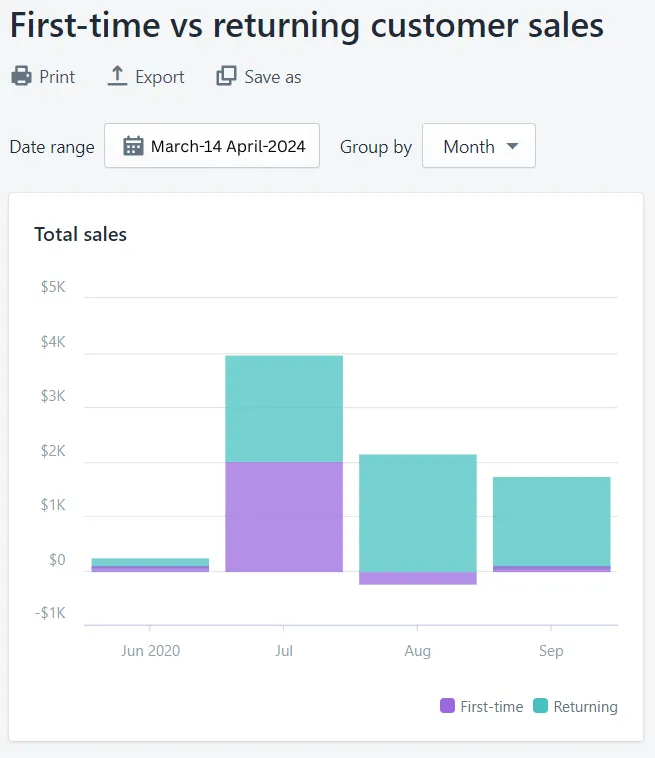
Understanding the ratio between first-time and returning customers reveals a lot about your retention efforts. Too many one-time buyers may signal weak loyalty or a poor follow-up experience. Use retargeting ads, follow-up emails, and loyalty rewards to encourage return visits and long-term customer relationships.
Having an e-commerce company without monitoring performance and ecommerce metrics is like driving blindfolded. You may be on the road for a while, but eventually, you will crash. Knowing these key ecommerce metrics isn’t about gazing at numbers, it’s about turning data into action. Every percentage, every bounce, every click is a story. When you learn to read that story, you gain the power to transform your brand, grow your business, and connect with your customers where they are.
So begin today. Review your existing data, know your weak areas, and select two or three metrics to focus on improving during the next quarter. When you see the difference, you’ll be amazed at how you ever operated your store without them.
And if you’re feeling swamped? Begin small. Track what’s most important today, and expand from there. Because in e-commerce, what you measure today is what you build tomorrow.
1. What are ecommerce metrics?
Ecommerce metrics are key performance indicators (KPIs) that help businesses track their performance, understand customer behavior, and measure the effectiveness of their operations and marketing strategies.
2. Why is website traffic important for ecommerce?
Website traffic shows how many people visit your store, which helps measure brand visibility, marketing effectiveness, and the potential for customer conversion. Monitoring traffic patterns can guide business strategy and optimization efforts.
3. What is the conversion rate, and how can I improve it?
The conversion rate is the percentage of website visitors who complete a desired action, such as making a purchase. To improve it, focus on optimizing the user experience, simplifying the checkout process, and using A/B testing to find the most effective features.
4. How does Average Order Value (AOV) impact my business?
AOV is the average amount customers spend per transaction. Increasing AOV can drive higher revenue without needing to acquire more customers. This can be achieved through product bundling, upselling, and loyalty programs.
5. What is Customer Acquisition Cost (CAC), and how is it calculated?
CAC measures the cost of acquiring a new customer, including marketing and advertising expenses. It’s essential for ensuring that customer acquisition efforts are cost-effective and sustainable in the long term.
6. How do I reduce cart abandonment rates?
Reducing cart abandonment can be done by offering clear product information, streamlining the checkout process, eliminating hidden fees, and providing multiple payment options. Offering incentives like discounts or free shipping can also help.
7. Why is the bounce rate an important metric?
Bounce rate measures the percentage of visitors who leave your site after viewing only one page. A high bounce rate suggests that visitors aren’t finding what they’re looking for or that the page is not engaging enough. Improving site speed and content relevance can help reduce bounce rates.
8. What is Return on Ad Spend (ROAS), and how can I improve it?
ROAS measures the revenue generated for every dollar spent on advertising. Improving ROAS requires refining targeting, experimenting with ad creatives, and optimizing the marketing funnel to maximize conversions.
9. What are the benefits of tracking customer lifetime value (CLV)?
CLV helps you understand the long-term value of a customer, allowing you to allocate marketing and retention resources more effectively. By increasing CLV, businesses can focus on nurturing loyal customers rather than acquiring new ones.
10. How do I track mobile traffic and conversion rates?
Mobile traffic and conversion rates should be tracked using analytics tools like Google Analytics. Optimizing your website for mobile users, improving loading times, and simplifying navigation will help enhance the mobile shopping experience.
In this ever-evolving world of e-commerce, if you want to be successful, pay attention towards key performance indicators (KPIs). These performance indicators have essential knowledge about how customers act as well as how efficiently operations run, and how well the business performs. The analysis of ecommerce metrics helps e-commerce businesses obtain information necessary for making decisions that support both expansion and profitability.
Looking to make your ecommerce website successful and don’t have an idea about key ecommerce metrics? Relax! At Proximate Solutions, we have listed 25 Ecommerce metrics in the blog to Help You Turn Data Into Revenue. Read this blog thoroughly and get to know what is essential for you!
Top Ecommerce metrics to track for growth are as follows:
The number of users visiting an online store makes the website traffic. Brand visibility and marketing performance can be measured through this basic metric. Knowing how visitors reach your website through direct organic and paid referrals contributes to understanding which paths deliver the most traffic. Organizations should use search engine optimization (SEO), content marketing coupled with social media engagement to increase website traffic. Traffic pattern monitoring throughout time creates observable trends that guide business strategy development.
Visitors who execute wanted actions on your site, like making a purchase, represent your conversion rate percentage. When your website makes successful sales to a significant portion of website visitors, you can consider it effective at customer acquisition. The enhancement of this metric depends on creating better user experiences and simplifying checkout processes while providing apparent calls to action. Testing discovers the perfect features that appeal to your audience, and A/B testing is perfect to do so.
AOV stands for the total expenditure throughout one customer purchase process. Enhancing the average order value in your business will increase your monetary revenue without requiring new customer acquisition. You can easily improve AOV by offering product bundles, upselling complementary items, and implementing loyalty programs that encourage higher spending.
Companies use CAC to measure all expenses related to recruiting new customers by counting both marketing campaigns and advertising costs. Business success requires a clear comprehension of CAC because customers should not cost more than they generate long-term value. An improved CAC requires companies to develop precise customer targeting methods, affordable advertising platforms, and natural growth promotion through SEO and content marketing efforts.
Customer Lifetime Value allows businesses to forecast the total monetary revenue that will come from individual customer accounts. Assessing customer relationship long-term value becomes possible when reviewing CLV metrics in relation to CAC figures. Improving CLV depends on delivering outstanding service, tailored shopping experiences supported by loyalty reward systems, and motivation to buy again.
The percentage of users who add items to their cart but do not complete the purchase. High numbers of abandoned carts usually indicate problems with purchasing complexity, hidden fees, or unavailable payment methods. Cart abandonment can be reduced by keeping payments flexible and presenting costs clearly with an easy checkout procedure.
The percentage of users that exit from your site after looking at only one page is termed the bounce rate. If your visitors spend less than two seconds on your landing pages before returning to the previous page, you should check whether your pages are relevant to their needs. You can reduce bounce rate by loading website pages faster, and content delivers enhanced quality that matches visitor expectancies.
ROAS determines advertising performance through revenue calculations based on each dollar spent on promotional activities. Advertising efficiency increases when ROAS becomes higher. To improve ROAS it requires regular updates to ad creative formats, improved audience selection precision, and testing several advertising channels to identify the most economical choices.
Inventory turnover measures the frequency with which inventory sells out and generates new replacements within a stated period. High turnover rates demonstrate profitable sales performance with effective inventory control systems. An accurate assessment of sales data combined with demand forecasting and the avoidance of warehouse excess will enhance inventory turnover through effective just-in-time inventory management.
After conducting NPS research, you can determine customer satisfaction levels and loyalty through their recommendations to others. High customer satisfaction levels will generate an elevated rate of Net Promoter Score. Your NPS improvement strategy should deliver top-quality service and collect active feedback while fostering deep connections with all your clients across your customer base.
These metrics gauge the effectiveness of email marketing campaigns. Success in reaching recipients occurs when your emails receive high open rates and recipients choose to click through the emails. Achieving better email performance depends on engaging subject lines with personalized content and offering immediate value to customers in each message.
Social media analytic tools enable businesses to observe user reactions by monitoring social media engagement statistics, including likes, shares, comments, and total audience responses. Your involvement with readers helps attract more consumers while developing an audience focused on your brand. Social media engagement climbs through sharing content easily, maintaining steady contact with followers, and utilizing content created by users.
The continuous rise of mobile shopping demands that businesses track mobile audience movements and conversions to enhance the quality of their mobile user journey. To increase mobile conversions, you must design your website for mobile devices, enhance loading speed, and provide straightforward navigation paths.
Online pages that take too long to load will downgrade user satisfaction and search engine rankings. The loading speed of web pages determines both customer satisfaction and the number of bounces that website visitors perform. Images need optimization, and browser caching and code simplification help speed up loading times.
Issues with product quality or misaligned customer expectations result in high return rates. The reasons behind returns can inform product descriptions and quality control. Clear product images, detailed descriptions, and customer reviews can help set accurate expectations.
The metric defines the percentage of customers who make repeat purchases. A high retention rate means your customer is satisfied and loyal. You can enhance your retention rate by implementing loyalty programs, personalized marketing, and excellent customer service.
Gross profit margin indicates the share of revenue left after subtracting the cost of goods sold (COGS), whereas net margin represents profit after every expense, including operations, marketing, and taxes. Both margins are crucial indicators of overall profitability and operational effectiveness. For their enhancement, analyze your pricing models, secure improved supplier contracts, and manage operational expenses without damaging customer experience.
Average time spent by users on your website is a great measure of engagement. Longer session times usually indicate that visitors are interested in your products or content. If users leave immediately, it may indicate a bad UX or irrelevant content. Enhance this metric by optimizing product pages, employing strong visuals, and adding internal links to similar products and blog articles.
CSAT is gauged by direct questioning customers as to whether they’re satisfied with a product or service. It’s an easy but effective measure of overall satisfaction. To boost your CSAT, make customer support more accessible, enhance product quality, and provide after-sales support that goes beyond expectations.
Knowing what marketing channels (email, social media, pay-per-click advertising, SEO) are generating the most revenue helps you budget your dollars more strategically. Monitor channel performance using Google Analytics or Shopify analytics. Reinvest in successful channels, and optimize those not performing as well or needing to be better strategy aligned.
Not every product page converts the same. Monitoring the performance of every single product page determines what works and what doesn’t. Experiment with various layouts, product descriptions, CTAs, and review placements. Rich media such as videos or 360° views can dramatically increase engagement and conversions.
Exit page analysis indicates where users tend to leave your site. This can help determine friction points in the customer flow. For instance, if users tend to leave from the cart page, your checkout process might be too complex. Utilize heatmaps and session recordings to observe what’s occurring and improve UX based on that.
If you offer subscriptions, your churn rate is the rate at which customers cancel during a given period. High churn indicates that users aren’t experiencing long-term value in your service or product. To limit churn, invite users with onboarding messages, reminders, and incentives for longer-term subscription.
This tracks how many visitors become leads (email list subscribers, account creators, etc.). A solid ratio means that your site attracts quality traffic. If the ratio is low, rethink your messaging or CTA placements. Make use of lead magnets such as discounts, free downloads, or special offers in order to generate conversions.
Understanding the ratio between first-time and returning customers reveals a lot about your retention efforts. Too many one-time buyers may signal weak loyalty or a poor follow-up experience. Use retargeting ads, follow-up emails, and loyalty rewards to encourage return visits and long-term customer relationships.
Having an e-commerce company without monitoring performance and ecommerce metrics is like driving blindfolded. You may be on the road for a while, but eventually, you will crash. Knowing these key ecommerce metrics isn’t about gazing at numbers, it’s about turning data into action. Every percentage, every bounce, every click is a story. When you learn to read that story, you gain the power to transform your brand, grow your business, and connect with your customers where they are.
So begin today. Review your existing data, know your weak areas, and select two or three metrics to focus on improving during the next quarter. When you see the difference, you’ll be amazed at how you ever operated your store without them.
And if you’re feeling swamped? Begin small. Track what’s most important today, and expand from there. Because in e-commerce, what you measure today is what you build tomorrow.
1. What are ecommerce metrics?
Ecommerce metrics are key performance indicators (KPIs) that help businesses track their performance, understand customer behavior, and measure the effectiveness of their operations and marketing strategies.
2. Why is website traffic important for ecommerce?
Website traffic shows how many people visit your store, which helps measure brand visibility, marketing effectiveness, and the potential for customer conversion. Monitoring traffic patterns can guide business strategy and optimization efforts.
3. What is the conversion rate, and how can I improve it?
The conversion rate is the percentage of website visitors who complete a desired action, such as making a purchase. To improve it, focus on optimizing the user experience, simplifying the checkout process, and using A/B testing to find the most effective features.
4. How does Average Order Value (AOV) impact my business?
AOV is the average amount customers spend per transaction. Increasing AOV can drive higher revenue without needing to acquire more customers. This can be achieved through product bundling, upselling, and loyalty programs.
5. What is Customer Acquisition Cost (CAC), and how is it calculated?
CAC measures the cost of acquiring a new customer, including marketing and advertising expenses. It’s essential for ensuring that customer acquisition efforts are cost-effective and sustainable in the long term.
6. How do I reduce cart abandonment rates?
Reducing cart abandonment can be done by offering clear product information, streamlining the checkout process, eliminating hidden fees, and providing multiple payment options. Offering incentives like discounts or free shipping can also help.
7. Why is the bounce rate an important metric?
Bounce rate measures the percentage of visitors who leave your site after viewing only one page. A high bounce rate suggests that visitors aren’t finding what they’re looking for or that the page is not engaging enough. Improving site speed and content relevance can help reduce bounce rates.
8. What is Return on Ad Spend (ROAS), and how can I improve it?
ROAS measures the revenue generated for every dollar spent on advertising. Improving ROAS requires refining targeting, experimenting with ad creatives, and optimizing the marketing funnel to maximize conversions.
9. What are the benefits of tracking customer lifetime value (CLV)?
CLV helps you understand the long-term value of a customer, allowing you to allocate marketing and retention resources more effectively. By increasing CLV, businesses can focus on nurturing loyal customers rather than acquiring new ones.
10. How do I track mobile traffic and conversion rates?
Mobile traffic and conversion rates should be tracked using analytics tools like Google Analytics. Optimizing your website for mobile users, improving loading times, and simplifying navigation will help enhance the mobile shopping experience.